This last week at the United Nations World Data Forum in Cape Town I and a lot of other people liked the presentation by Rebecca Firth of HOT, the Humanitarian Open Street Map Team. She showed how HOT stimulates people to help chart areas yet unmapped. Although HOT is not at all trying ‘to tell a story’ around the data they collect, their methods resonated with me as I thought about the story-aspect being so prominently on everyone’s mind at the WDF.
Statisticians and advocates of data like myself dream of impact. How to reach the hearts and minds of the audience? Everyone agrees that just putting the numbers out there will not do. Some form of storytelling seems to be the best way forward. But what does ‘a story’ mean? As a metaphor, it has many ways to be understood.
Editor vs author
In another presentation, someone labeled a regular, color shaded world map as a ‘story map’. This for me is taking the metaphor a bit far. Data can be telling, yes. But choice of color, ranges and other decisions reveal the hand of the editor, not so much of an author. The content doesn’t go beyond the dataset. With captivating visuals, time sequences and narrative elements, the editor becomes more of an author. He can bring relevancy to light as the famous sculptor does when he carves out an image already hidden in the marble. Stories worth listening to.
The powerful aspect of HOT for me, however, was the way they approach their volunteers. These have a desire to be involved with the world, to contribute something, a real and powerful emotion. HOT answers to it, providing easy-to-use technology, showing immediate feedback on the contributed work, even introducing a competitive ranking. It made me realize the best story starts with the listener. A storyteller tries to connect with the desires and fears of his audience, as the primary building blocks of his story-to-be. Translated to the world of statistics, a compelling story may very well not depart from the data. It will start at a point relevant to the listener, and then venture towards data.
The Dollar Street project, also in one of the presentations, goes a long way into this direction. It visually documents households across the income range worldwide. Systematically, images show toys, toilets, front doors and such for all of them. As everyone lives in a household of his own, you are bound to start comparing your own life circumstances to those of others. I would call this a story, and a beautiful one.
Storytellers
How to stimulate awareness and usage of statistics coming out of the Sustainable Development Goals, censuses and other sources? With HOT in mind, my bet would be to single out something that drives the audience, a practical need, a lofty desire, and to start a story from there. The challenge, the added quality of the storyteller, will be to connect the world of data to this drive in a way that’s meaningful for all concerned.
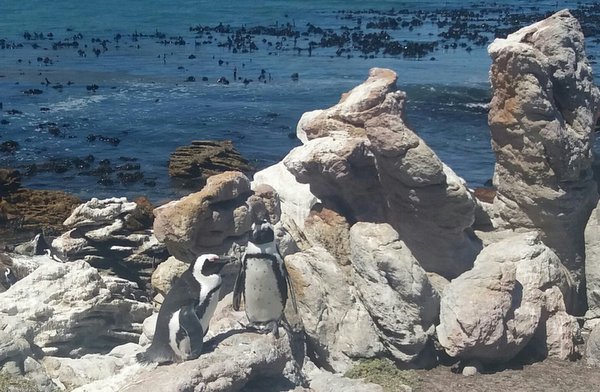
This morning I saw two penguins here in Betty’s Bay, east of Cape Town, standing aside a bit from the hundreds of others. What would their story be?